
 The mission
ALTIUS (Atmospheric Limb Tracker for Investigation of the Upcoming Stratosphere) is a satellite mission developed at BIRA-IASB. ALTIUS development involves industrial partners and is currently in phase B2-C-D within the frame of an ESA Earth Watch Mission.
ALTIUS is a three-channel (UV, VIS and NIR) spectral imager performing limb observation. Its primary objective is the monitoring of stratospheric ozone (O3) at high vertical resolution.
ALTIUS detectors characterization
As part of the collaboration with the industrial partners, B.RCLab is responsible for the characterization of the UV and VIS Engineering Model (EM) detectors. These are 2000x1504 pixel CMOS technology Teledyne e2v CIS115 model.
The main characterization task is the calculation of the Quantum Efficiency (QE) of the detectors. QE represents the detection efficiency of the detector expressed as the ratio of the number of electrons produced to the number of photons received by the sensitive element, generally a pixel. Aditional characterizations include the Dark Current (DC) level, Photo-Response non Uniformity (PRNU) and linearity.
Experimental setup
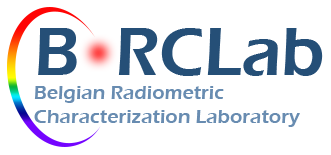
The experimental setup, shown in Figure 1, is composed of a Bentham double monochromator, three different light sources, an integrating sphere and the reference photodiodes: Silicon (Si) and Germanium (Ge) photodiodes, calibrated by the PTB in spectral power responsivity (A/W), from 200 nm to 1100 nm and from 700 nm to 1800 nm for the Si and Ge, respectively.
Thanks to the absolute calibration of the photodiodes, the number of electrons produced by the CIS115 detectors, translated into digital output, can be correlated to the number of incident photons. The QE is in a broad sense calculated as the ratio of the number of electron produced to number of photons received. In addition, a geometrical factor derived from the difference in the viewing geometry of the integrating sphere between the CIS115 and the photodiodes, is incorporated into the equation.
Detector performances
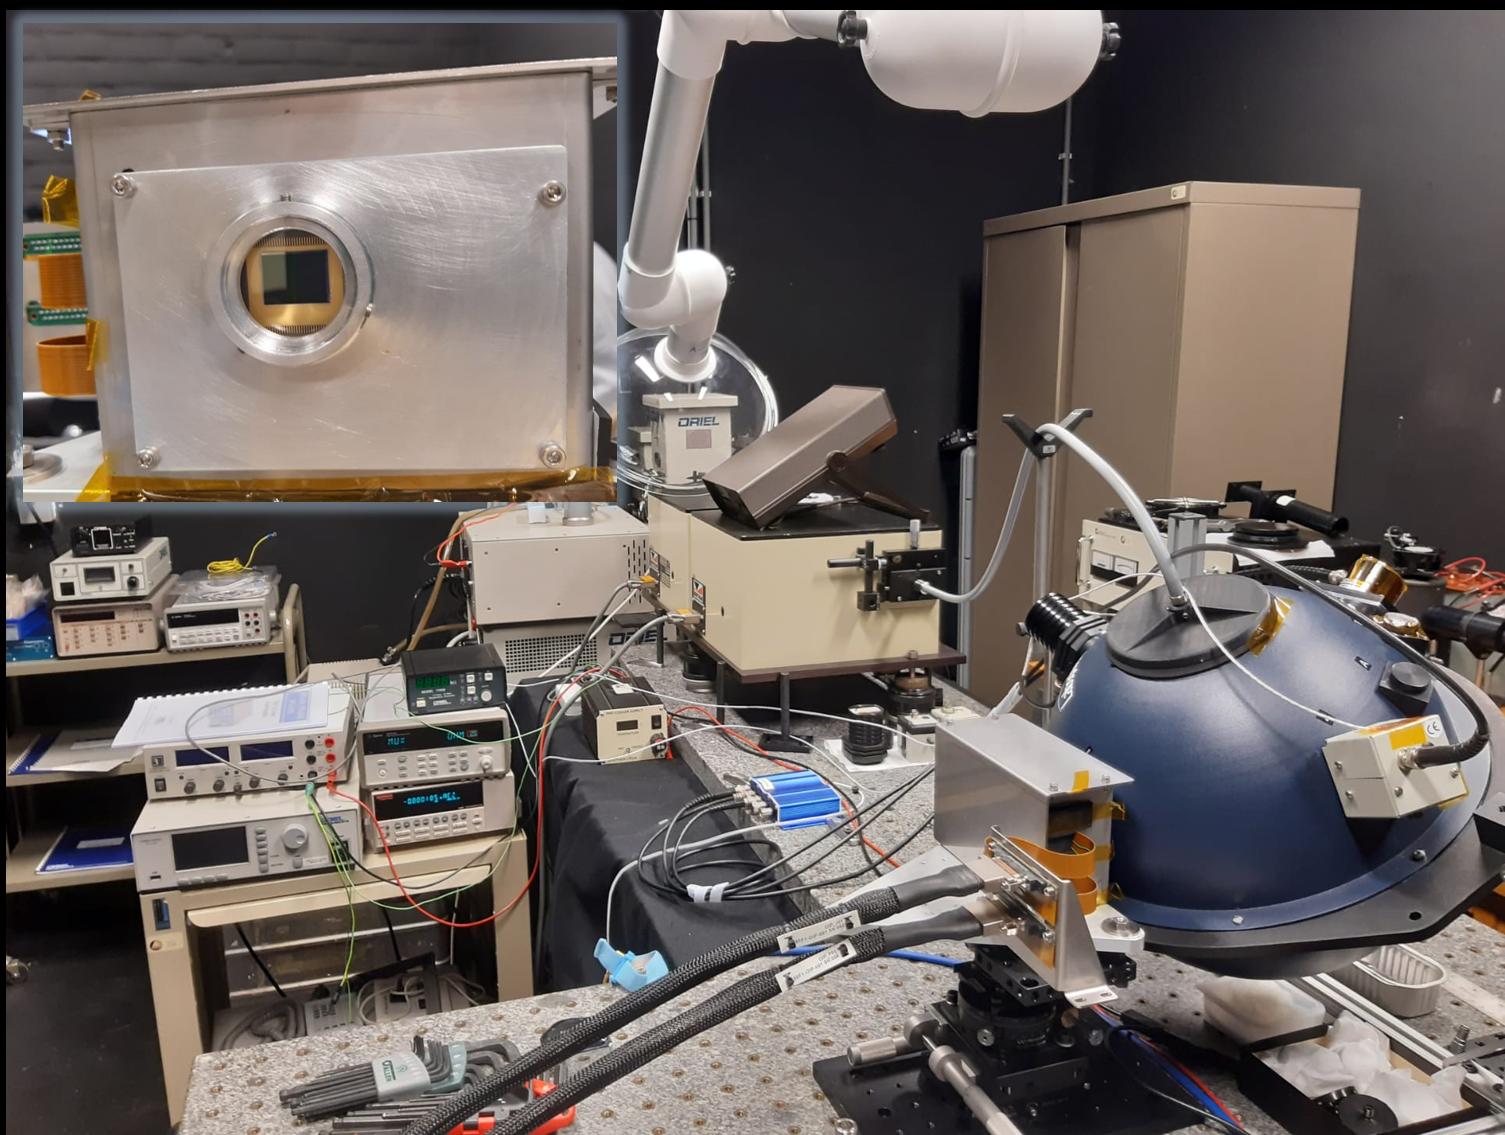
Figure 2 illustrates an image captured by the UV detector during the QE measurement campaign. The effects of vignetting in the image due to the finite distance between the detector sensitive surface and the integrating sphere port are clearly visible as a concentric structure.
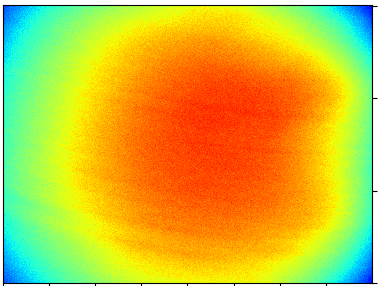
The determined QE curves for the UV and VIS detectors is available in Figure 3.
Measurements to determine the QE of the UV detector are currently in progress. The results obtained for the VIS detector (Figure 3) are still subject to additional corrections mainly due to non-linearities.
List of publications about ALTIUS
| |
 |
|


